- 15 Jul
5 Cash Flow Metrics Every Business Should Check Each Month
Successful businesses rarely wait until cash becomes a problem before taking action. Instead, they monitor a handful of important figures that can provide an early warning if cash flow starts to come under pressure.
You don't need complicated financial reports or expensive software to understand how your business is performing. By reviewing just five key metrics each month, you can spot trends early and make informed decisions before small issues become larger ones.
If you're looking for a broader introduction to managing business cash flow, our Cash Flow Guide explains the key concepts before you start measuring your own performance.
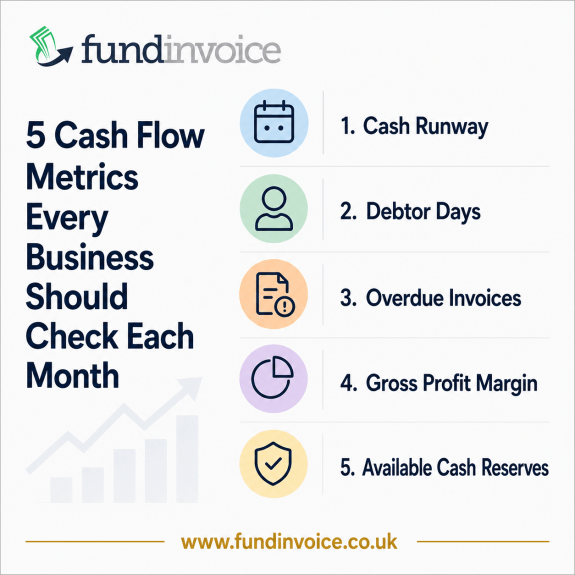 5 Cash Flow Metrics To Monitor Each Month
1) Cash Runway
Cash runway shows how many months your business could continue operating if no more cash came in.
Cash runway measures how long your business could continue operating if income were reduced or stopped altogether. It takes into account the cash you currently have available and your regular monthly operating costs.
Explanation: Cash runway is calculated by dividing your available cash by your average monthly operating costs.
Formula: Cash Runway (Months) = Available Cash ÷ Average Monthly Operating Costs
A longer cash runway generally gives a business greater flexibility during quieter trading periods, unexpected delays in customer payments or temporary market downturns.
If your available cash would only cover a few weeks of normal operating costs, it may be worth reviewing your cash flow forecast and considering ways to strengthen your financial resilience. This could include reducing costs, improving collections or arranging access to funding to create a larger cushion.
2) Debtor Days
Debtor days show how long, on average, customers take to pay your invoices.
Even profitable businesses can experience cash flow pressure if customer payments begin arriving later than expected.
Explanation: Debtor days are calculated by dividing your trade debtors (accounts receivable) by annual credit sales, then multiplying the result by 365.
Formula: Debtor Days = Trade Debtors ÷ Annual Credit Sales × 365
Watch for gradual increases over several months rather than focusing on individual late payments. A steady rise often indicates that more working capital is becoming tied up in unpaid invoices.
Improving invoicing procedures, promptly following up overdue accounts and reviewing customer payment terms can often reduce debtor days without affecting customer relationships.
See our credit control guide for more help with reducing debtor days.
3) Overdue Invoices
This measures the proportion of your outstanding sales ledger that has passed its agreed payment date.
The total value and percentage of overdue invoices can provide a useful indication of your customers' payment performance and the likely effect on future cash flow.
Explanation: The percentage of overdue invoices measures the share of your outstanding sales ledger that is overdue for payment.
Formula: Overdue Invoices (%) = Value of Overdue Invoices ÷ Total Sales Ledger × 100
If the percentage continues to increase, it may suggest that customers are experiencing financial pressure themselves or that your credit control procedures need attention.
Regularly reviewing overdue debt helps your business prioritise collections before late invoices become bad debts. It can also reveal whether the problem is concentrated among one or two customers or affecting the wider sales ledger.
4) Gross Profit Margin
Gross profit margin shows how much of each pound of sales remains after paying the direct costs of supplying your goods or services.
Growing sales do not always lead to stronger cash flow. If gross margins begin to fall, your business may need to sell significantly more just to generate the same level of cash.
Explanation: Gross profit margin shows how much of every £1 of sales your business keeps after paying the direct costs of delivering its products or services, before overheads and other operating expenses.
Formula: Gross Profit Margin (%) = (Sales Turnover − Cost of Sales) ÷ Sales Turnover × 100
Rising supplier costs, discounting or changes in customer mix can all reduce margins over time. Monitoring gross profit margin alongside turnover helps determine whether increased sales are genuinely improving the business's financial position.
5) Available Cash Reserves
Available cash reserves show how much money the business can use after allowing for essential short-term commitments.
Every business experiences unexpected costs from time to time. Maintaining an appropriate cash reserve can help absorb these shocks without disrupting day-to-day trading.
Explanation: Available cash reserves are the funds immediately available to meet day-to-day commitments after accounting for essential short-term obligations.
Formula: Available Cash Reserves = Cash at Bank + Cash on Hand − Immediate Financial Commitments
There is no single figure that suits every business. Regularly reviewing available cash alongside expected commitments, such as VAT, PAYE, wages and supplier payments, provides a more realistic picture of liquidity than simply looking at the current bank balance.
Looking At The Bigger Picture
Each of these measures provides useful information on its own, but they become much more valuable when considered together. For example, rising debtor days combined with falling cash reserves may highlight a developing working capital issue long before it becomes obvious from the bank balance alone.
You don't need perfect figures every month. The real value comes from monitoring trends over time. If debtor days gradually increase, gross margins decline or cash reserves steadily fall, these early warning signs may provide an opportunity to take action before cash flow becomes a serious problem.
Reviewing these figures once a month takes relatively little time, but it can help identify pressure on the business's cash position before it affects suppliers, staff or future growth. The earlier an issue is identified, the more options a business will usually have to resolve it.
Check Your Business
Not sure how your business performs against these five measures? Our free Cash Flow Improvement Tool reviews several key indicators and provides practical suggestions that may help strengthen your cash flow and overall financial position.
Disclaimer: This article is provided for general information only and should not be relied upon as accounting, tax or financial advice. Every business is different, so you should seek professional advice appropriate to your circumstances before making financial decisions.

5 Cash Flow Metrics Every Business Should Check Each Month
Call us: 03330 113622
- Home
- Business Financing
- Invoice Finance
- Invoice Discounting
- Factoring
- Debt Factoring
- Recourse Factoring
- Fund Selected Invoices
- Business Loans
- Construction Sector Funding
- Protect Against Bad Debts
- Exports Collection And Funding
- Import Funding
- Body Shop Funding
- Spot Factoring
- Retail Sector Funding
- Fund Invoices Confidentially
- Help Running Your Payroll
- CHOCs Customer Handles Own Collections
- Collect Invoices Confidentially And Funding
- Outsourcing Your Credit Control
- Asset Finance And Mortgages
- Case Studies
- About Us
- Testimonials
- Find Out More
- News
- Free Magazine
- Blog